How to Approach MCAT Research-based Passages
To understand research-based passages on the MCAT, it is critical to understand the language in which research is written. That language is known as the scientific method, and in this article, I will review that language and illustrate how one can use this knowledge as a frame-work to understand any scientific research passage. Given the medium of writing, I must be very brief, however, I go into grand detail in my lectures from my MCAT prep courses, which you can find at mcatdisciple.com.
The scientific method is broken down into six steps: question, hypothesis, study design, measurements/data collection, data analysis, and conclusion. On the MCAT, one or more of these steps, usually the conclusion, may be omitted for testing purposes. I would like to reiterate that research-based passages on the MCAT are always written in this manner; keep this in mind while you read!
1. Question:
Every piece of research starts with a question; an inquiry about the world. A good research question is one that is specific, and testable. Normally, the question will be presented along with some background information and research about the question.
2. Hypothesis:
The hypothesis is the researcher’s prediction of the answer to the research question. An educated guess about the answer to the question. Like the question, it must be testable, and by nature of it being an answer to the question, specific. Specificity is garnered onto a hypothesis by the inclusion of variables, particularly independent and dependent variables. A variable is an aspect of a study that can have different (variable) values that can be measured or categorized. An independent variable (IV) is one that is suspected to have a causal effect on another variable. A dependent variable (DV), as the name suggests, is hypothesized to depend or change upon manipulation of the independent variable. “You manipulate the independent variable and measure a change in the dependent variable”. Below is an example of a good question and hypothesis.
Research Question: Does daily consumption of dandelions lower blood pressure?
Research Hypothesis: Consumption of 200 mg of dandelions every day for a year leads to decreased incidence of blood pressure measurements >140/90 mm Hg during a 3 year follow-up period.
IV: Consumption of x (Dandelion or control substance [a placebo])
DV: Blood pressure
Major key alert: A study may have several independent variables, but in any given group in the study, if it is a good study, only ONE independent variable will be intentionally manipulated at a time. This is critical, because if more than one independent variable is manipulated at a time, the researcher cannot tell which independent variable is producing the effect on the dependent variable!
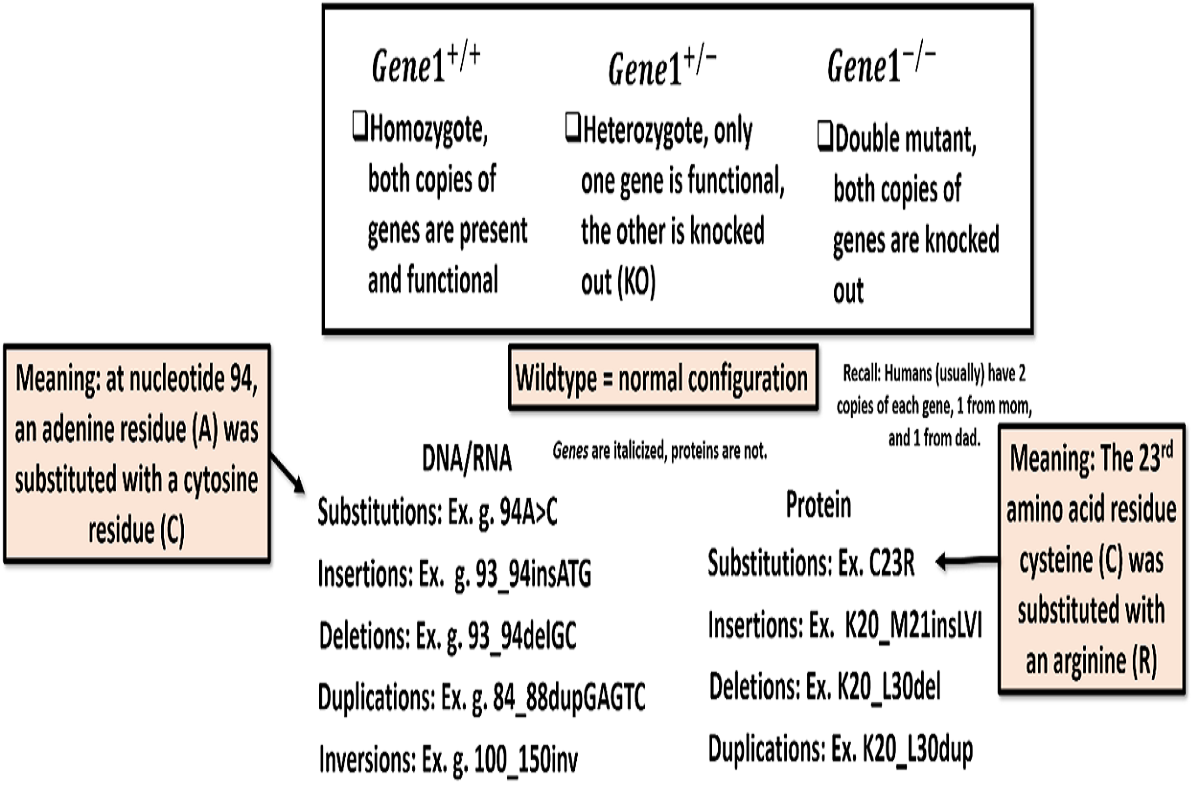
Major key alert: When it comes to biology, you will encounter many ways in which researchers represent that changes they make to the independent variable(s). See the image below for a summary of the many different types of notations you may see. If there are any other notations you run into, don’t get bent out of shape! Just use the question, hypothesis, and the context of the passage to intuit what the symbols mean.
To understand research-based passages on the MCAT, it is critical to understand the language in which research is written.
4. Measurements/Data collection: Measurements and data collections is all about using the appropriate methods to collect your data, which brings us to perhaps one of the most important points of this article, and that is operationalization. Operationalization is approximating a true variable of interest with one that can be measured or tabulated. This is best understood by way of example:
If you are a researcher who wants to prove conclusively that stress level increases in people during a bank robbery, how do you do it? You can’t directly measure stress; people can’t tell you how stressed they are feeling in a meaningful way that you can compare to other participants in the study. I am feeling “70%” stressed today, doesn’t quite cut it. So, what you do is you use something that is strongly and unequivocally correlated with the variable you want to measure.
In the case of stress, you can measure changes cortisol levels in the person’s blood, a hormone that is elevated in the blood during times of stress. This operationalization will allow you to collect your data in a standardized way.
Major key alert: The operationalization is not the true dependent variable, but rather a way to measure the dependent variable. One of the biggest mistakes you can make is confusing these two things. How do you find out what the true dependent variable is? The research question and/or hypothesis. In using our stress during a bank robbery example, the researchers don’t give a hoot about cortisol levels per-say; what they care about is to prove that bank robberies cause increased stress level, and thereby stress level is the true dependent variable, and if this compound is found to be elevated in this experiment, the researcher’s conclusion, and your own, will be that stress levels are elevated during bank robberies!
5. Data Analysis::Data analysis is typically done by statistical analysis. Statistics is used to determine whether differences in the dependent variable can be reasonably attributed to changes in the independent variable, or whether they were due simply to chance. While I will not discuss statistics, I will give you some tips for data analysis on the MCAT.
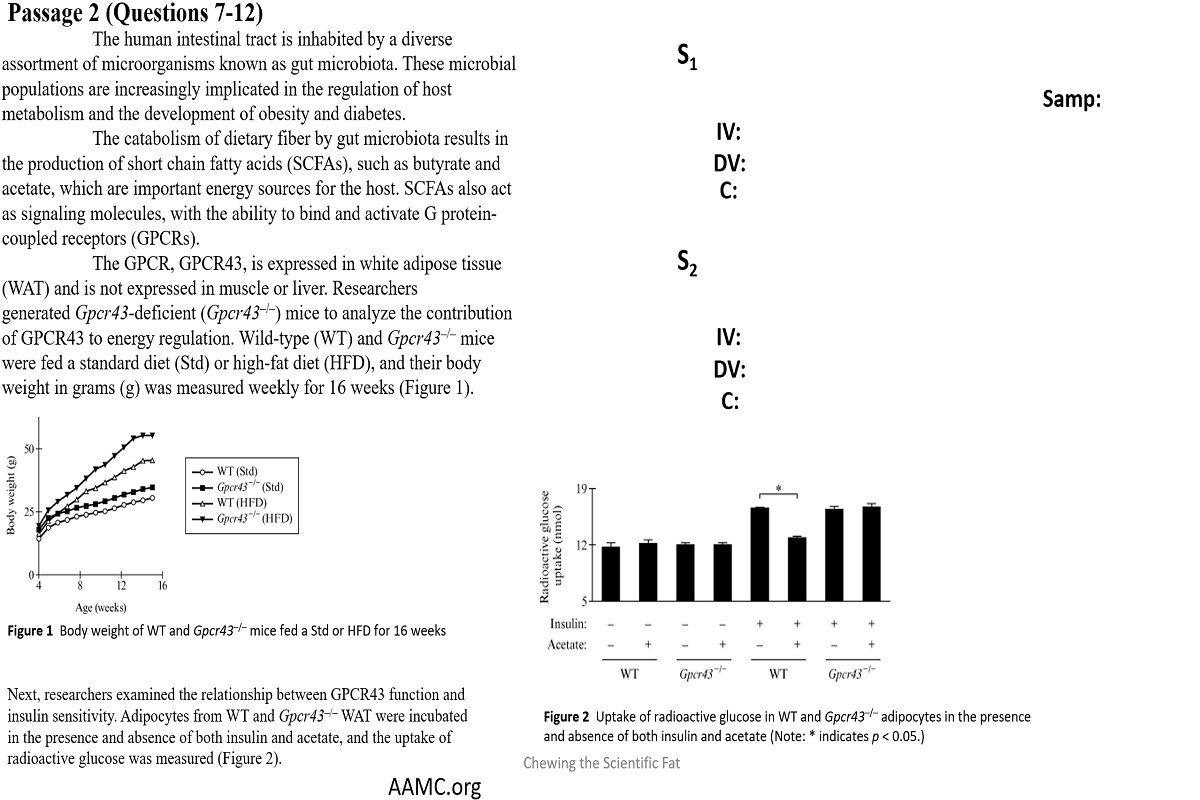
A significant difference in figures, graphs, and tables between study groups is usually signified by a symbol, usually a *. This (typically) means that researchers are at-least 95% confident that the results seen here are not due to chance.
In terms of analysis for figures, graphs, and tables, take the following steps:
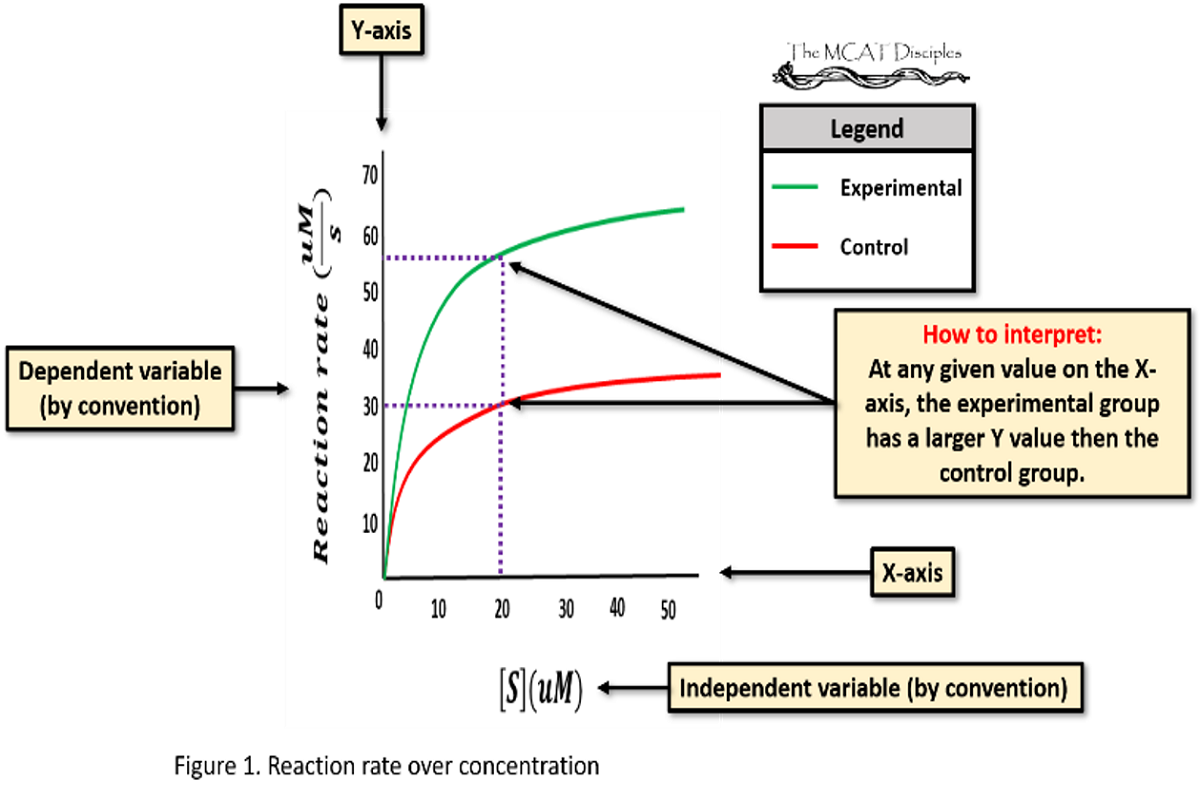
1. Look at the labels for title, X- axis, Y-axis, and legend.
Major key alert: It is the convention for the scientific method that the X-axis is the independent variable, and the Y-axis is the dependent variable (or the operationalization of the dependent variable).
- Find baseline (normal A.K.A. control).
- Compare baseline to experimental groups changing 1 variable at a time.
- Make a conclusion based on your analysis, preferably before you move onto the questions, as most questions will require you to use this newly concluded information to answer the question(s).
If you find yourself with a graph that you just can’t seem to glean any information from a ‘bird’s eye view’ if you would, what you should do is the following:
Place your pen on the X-axis and move vertically until you hit your first data point/line and then say…
“At any given x-value, experimental group has a (smaller or larger) Y-value then the control group”
This will hold true so long as the lines do not intersect again! If they do, you should this for each interval between where the lines intersect.
See the figure below for an example:
The conclusion is what the researcher makes out of the data that has been collected and analyzed. On the MCAT, this portion of the scientific method will often be omitted, and you will be asked to come to your own conclusions based on the data being presented. The most critical ideas for this section is that correlation is not equal to causation and the concepts internal and external validity.
Correlation describes the degree of relationship between two variables. If while variable 1 is observed to change variable 2 is observed to change in the same manner, they are said to be positively correlated, and if they change in an opposite manner, negatively correlated (Ex. Positive correlation: Ice cream sales are noted to go up on a hot day | Negative correlation: As TV sales go up, fitness level goes down). Correlation provides no information on causality; it simply describes an observation of a relationship between variables. For example, if you simply observed that people who eat red meat get cancer more often then people who do not, this information alone does not prove that red meat cause cancer. Why? Well, what if people who eat red meat also smoke more cigarettes? What if cancer causes people to eat red meat instead of red meat causing cancer? What if the observed relationship is just a coincidence? In terms of determining causality, we use Hill’s Criteria, which describes the components of an observed relationship that increases the likelihood of causality in a relationship. Explaining Hill’s criteria is a long conversation, so because of the medium of writing, I will not list it for you here, but of the nine components of Hill’s criteria, only the first one, temporality, is necessary, but not sufficient, to determine causality. This simply means that the independent variable comes before the change in the dependent variable in time (Ex. You give dandelions then blood pressure lowers). If an experiment can be done, a causal relationship can be determined conclusively.
Internal validity is the degree to which a causal relationship between the IV and the DV is shown or demonstrated. To determine if a study has internal validity, you should consider the extent to which the following are controlled for: confounding variables, bias (tendency to overestimate or underestimate a value in a systematic way), random error, and effect-to-cause (Y causes X instead of X causes Y).
External validity (generalizability) is the degree to which results of a study can be generalized to other situations. To determine this, you should look at sample size, whether the sample population is representative of the total population and were the environmental conditions like that of what is experienced by the total population. For example, if you ran an experiment to see how effective a coat is in Florida (a very hot climate) this study would not be generalizable to a population in Alaska (a very cold climate).
How to Approach MCAT Research-based Passages:
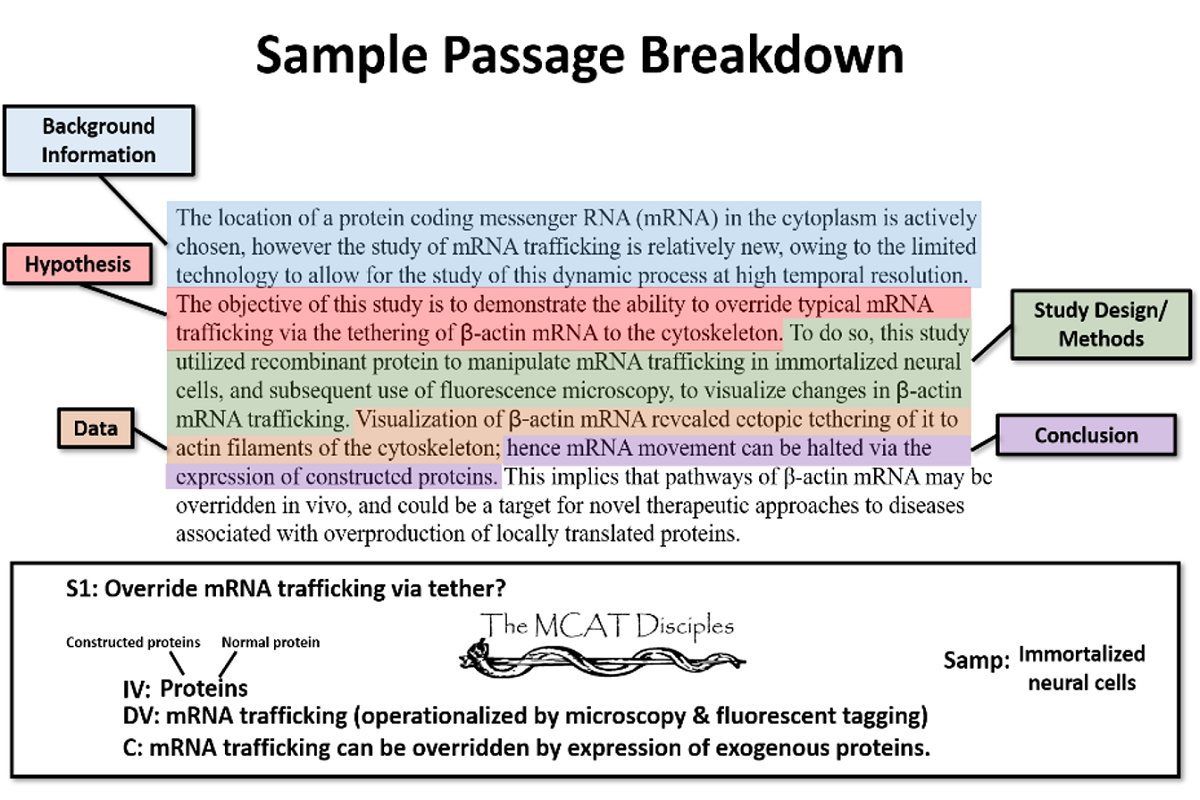
A typical research passage starts by first mentioning past findings that have had an influence on designing their research question, and then proceeds to the specific study by presenting the question and/or hypothesis, as well as methods used, then the passage depicts the data graphically and or verbally. The passage may then discuss analysis and conclusions, but this section is more likely to be left out for testing purposes. Using your knowledge of the scientific method and the below outlining method, you can easily decipher a passage into its basic components. The outlining method is basically dicing up the passage into the scientific method. You should write out a few of these outlines before your MCAT test begins, then fill it in as briefly as possible as you read. Use symbols (arrows, abbreviations, etc) where appropriate to cut down on writing time. You may find this time-consuming at first, but ultimately, it will save you time. Do not feel the need to use an outline for every research-based passage; only do it for ones that you did not instantly understand in your head! Let’s take an example passage.

Thank you for reading. A video version of this article, which includes a worked sample passage, can be found at https://youtu.be/mcNbOTAQCG8. Visit mcatdisciple.com to learn more about our MCAT prep courses, which start at $599, a fraction of the industry norm. Happy studies!
Looking for more Information?

Laureano Andrade Vicenty ( Professor )
Laureano Andrade Vicenty graduated from Rockland Community College with an associates degree in math and science. In 2016, he graduated Summa Cum Laude with a bachelors degree in biochemistry from Stony Brook University. Laureano is a medical student at the Warren Alpert Medical School at Brown University. Laureano scored in the 97th percentile on the new 2016 MCAT, and serves as the main lecturer for The MCAT Disciples.
Comments
David Jones
3 days agoYou have really outdone yourself here!
James O.
5 days agoWhat a great technique!
Jimmy C.
July 27, 2017Life-saver.
Pilaf
July 24, 2017Great stuff chief!